
Debugging and Profiling
Overview
Using a combination of PhpStorm, DDEV and Xdebug makes debugging a pleasure. PhpStorm is not essential. Xdebug works fine with other IDE's also. In my experience, many Drupal developers have not experienced using a true debugger, but once they do, they wonder how they ever delivered any code without it.
Enable error reporting
If you experience a WSOD (White Screen Of Death), enabling verbose error messages in your sites\default\settings.local.php can often give you some useful clue:
$config['system.logging']['error_level'] = 'verbose';For more, check out this question on Stack Exchange. Also error reporting levels are defined in bootstrap.inc as follows:
/**
 * Error reporting level: display no errors.
 */
const ERROR_REPORTING_HIDE = 'hide';

/**
 * Error reporting level: display errors and warnings.
 */
const ERROR_REPORTING_DISPLAY_SOME = 'some';

/**
 * Error reporting level: display all messages.
 */
const ERROR_REPORTING_DISPLAY_ALL = 'all';

/**
 * Error reporting level: display all messages, plus backtrace information.
 */
const ERROR_REPORTING_DISPLAY_VERBOSE = 'verbose';
Disable caching and enable TWIG debugging
Generally I enable twig debugging and disable caching while developing a site. This means I don't have to do a drush cr each time I make a change to a template file.
Note
The new way to enable Twig debugging is via the user interface. In the menus select Configuration, Development, Development Settings (or navigate to /admin/config/development/settings) and check the Twig development mode box, then check the boxes for Twig debug mode and disable Twig cache. You can also check the Do not cache markup at this time.
To enable TWIG debugging output in source, in sites/default/development.services.yml set twig.config debug:true. See core.services.yml for lots of other items to change for development.
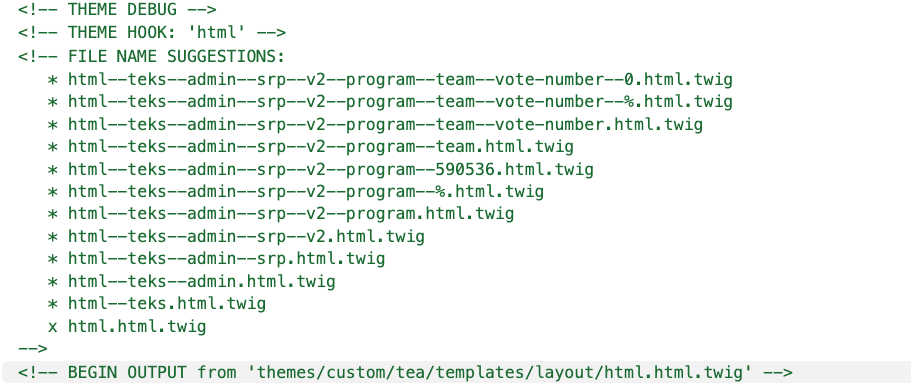
TWIG debugging output looks like this:
# Local development services.
#
# To activate this feature, follow the instructions at the top of the
# 'example.settings.local.php' file, which sits next to this file.
parameters:
  http.response.debug_cacheability_headers: true
  twig.config:
    debug: true
    auto_reload: true
    cache: false

# To disable caching, you need this and a few other items
services:
  cache.backend.null:
    class: Drupal\Core\Cache\NullBackendFactory
Here is the entire development.services.yml file that I usually use:
# Local development services.
#
# put this in /sites/development.services.yml
#
# To activate this feature, follow the instructions at the top of the
# 'example.settings.local.php' file, which sits next to this file.
parameters:
  http.response.debug_cacheability_headers: true
  twig.config:
    # Twig debugging:
    #
    # When debugging is enabled:
    # - The markup of each Twig template is surrounded by HTML comments that
    #   contain theming information, such as template file name suggestions.
    # - Note that this debugging markup will cause automated tests that directly
    #   check rendered HTML to fail. When running automated tests, 'debug'
    #   should be set to FALSE.
    # - The dump() function can be used in Twig templates to output information
    #   about template variables.
    # - Twig templates are automatically recompiled whenever the source code
    #   changes (see auto_reload below).
    #
    # For more information about debugging Twig templates, see
    # https://www.drupal.org/node/1906392.
    #
    # Not recommended in production environments
    # @default false
    debug: true
    # Twig auto-reload:
    #
    # Automatically recompile Twig templates whenever the source code changes.
    # If you don't provide a value for auto_reload, it will be determined
    # based on the value of debug.
    #
    # Not recommended in production environments
    # @default null
    #    auto_reload: null
    auto_reload: true
    # Twig cache:
    #
    # By default, Twig templates will be compiled and stored in the filesystem
    # to increase performance. Disabling the Twig cache will recompile the
    # templates from source each time they are used. In most cases the
    # auto_reload setting above should be enabled rather than disabling the
    # Twig cache.
    #
    # Not recommended in production environments
    # @default true
    cache: false
services:
  cache.backend.null:
    class: Drupal\Core\Cache\NullBackendFactory
You need to enable your development.services.yml file so add this to your settings.local.php:
/**
 * Enable local development services.
 */
$settings['container_yamls'][] = DRUPAL_ROOT . '/sites/development.services.yml';
You also need to disable caches and JS/CSS preprocessing in settings.local.php with:
$config['system.performance']['css']['preprocess'] = FALSE;
$config['system.performance']['js']['preprocess'] = FALSE;
$settings['cache']['bins']['render'] = 'cache.backend.null';
$settings['cache']['bins']['page'] = 'cache.backend.null';
$settings['cache']['bins']['dynamic_page_cache'] = 'cache.backend.null';
Enable/Disable Xdebug
To enable or disable Xdebug when using DDEV use:
ddev xdebug on

ddev xdebug off
Note. Enabling Xdebug will slow down your app because xdebug has a significant performance impact so be sure to disable it when you are finished debugging.
Add this to your .zshrc or .bash file for `xon` and `xoff` shortcut
alias xon='ddev xdebug on'
alias xoff='ddev xdebug off'
Xdebug Port
DDEV now sets the default port to 9003. If you want to change it to another port, use the steps below. From https://ddev.readthedocs.io/en/stable/users/debugging-profiling/step-debugging/#using-xdebug-on-a-port-other-than-the-default-9003:
To override the port, add an override file in the project's .ddev/php directory. For example, add the file .ddev/php/xdebug_client_port.ini like this to specify the legacy port 9000:
[PHP]

xdebug.client_port=9000
Drupal code debugging
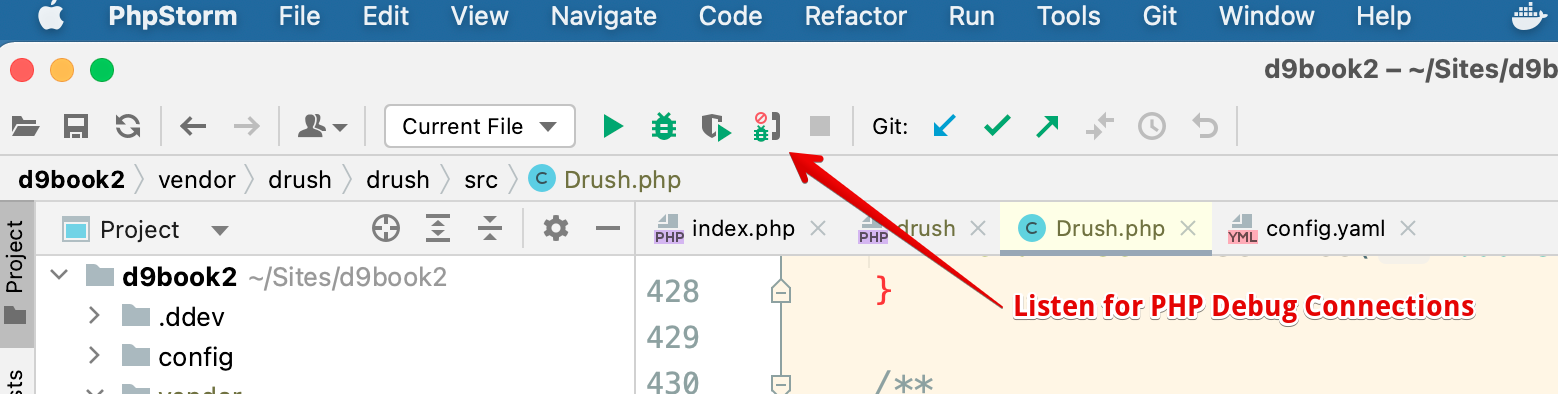
Phpstorm and DDEV make this process as painless as possible. Once you enable Xdebug in DDEV, simply click the "start listening for PHP Debug Connections" button.
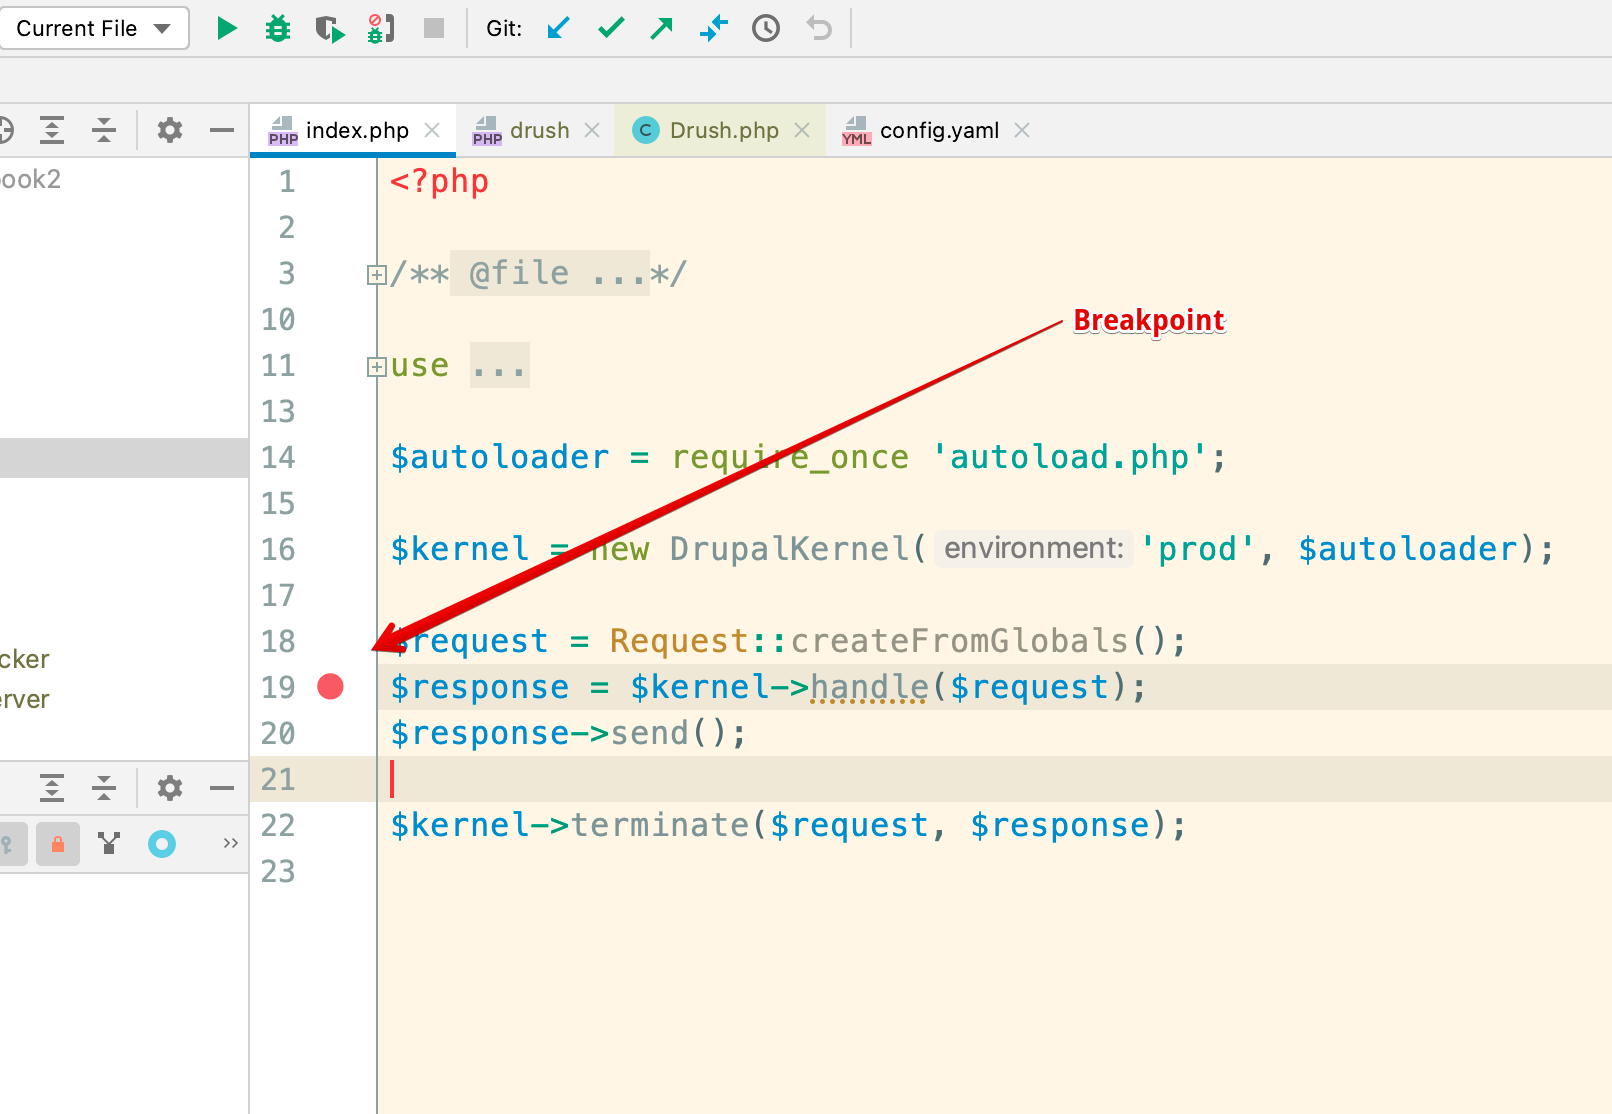
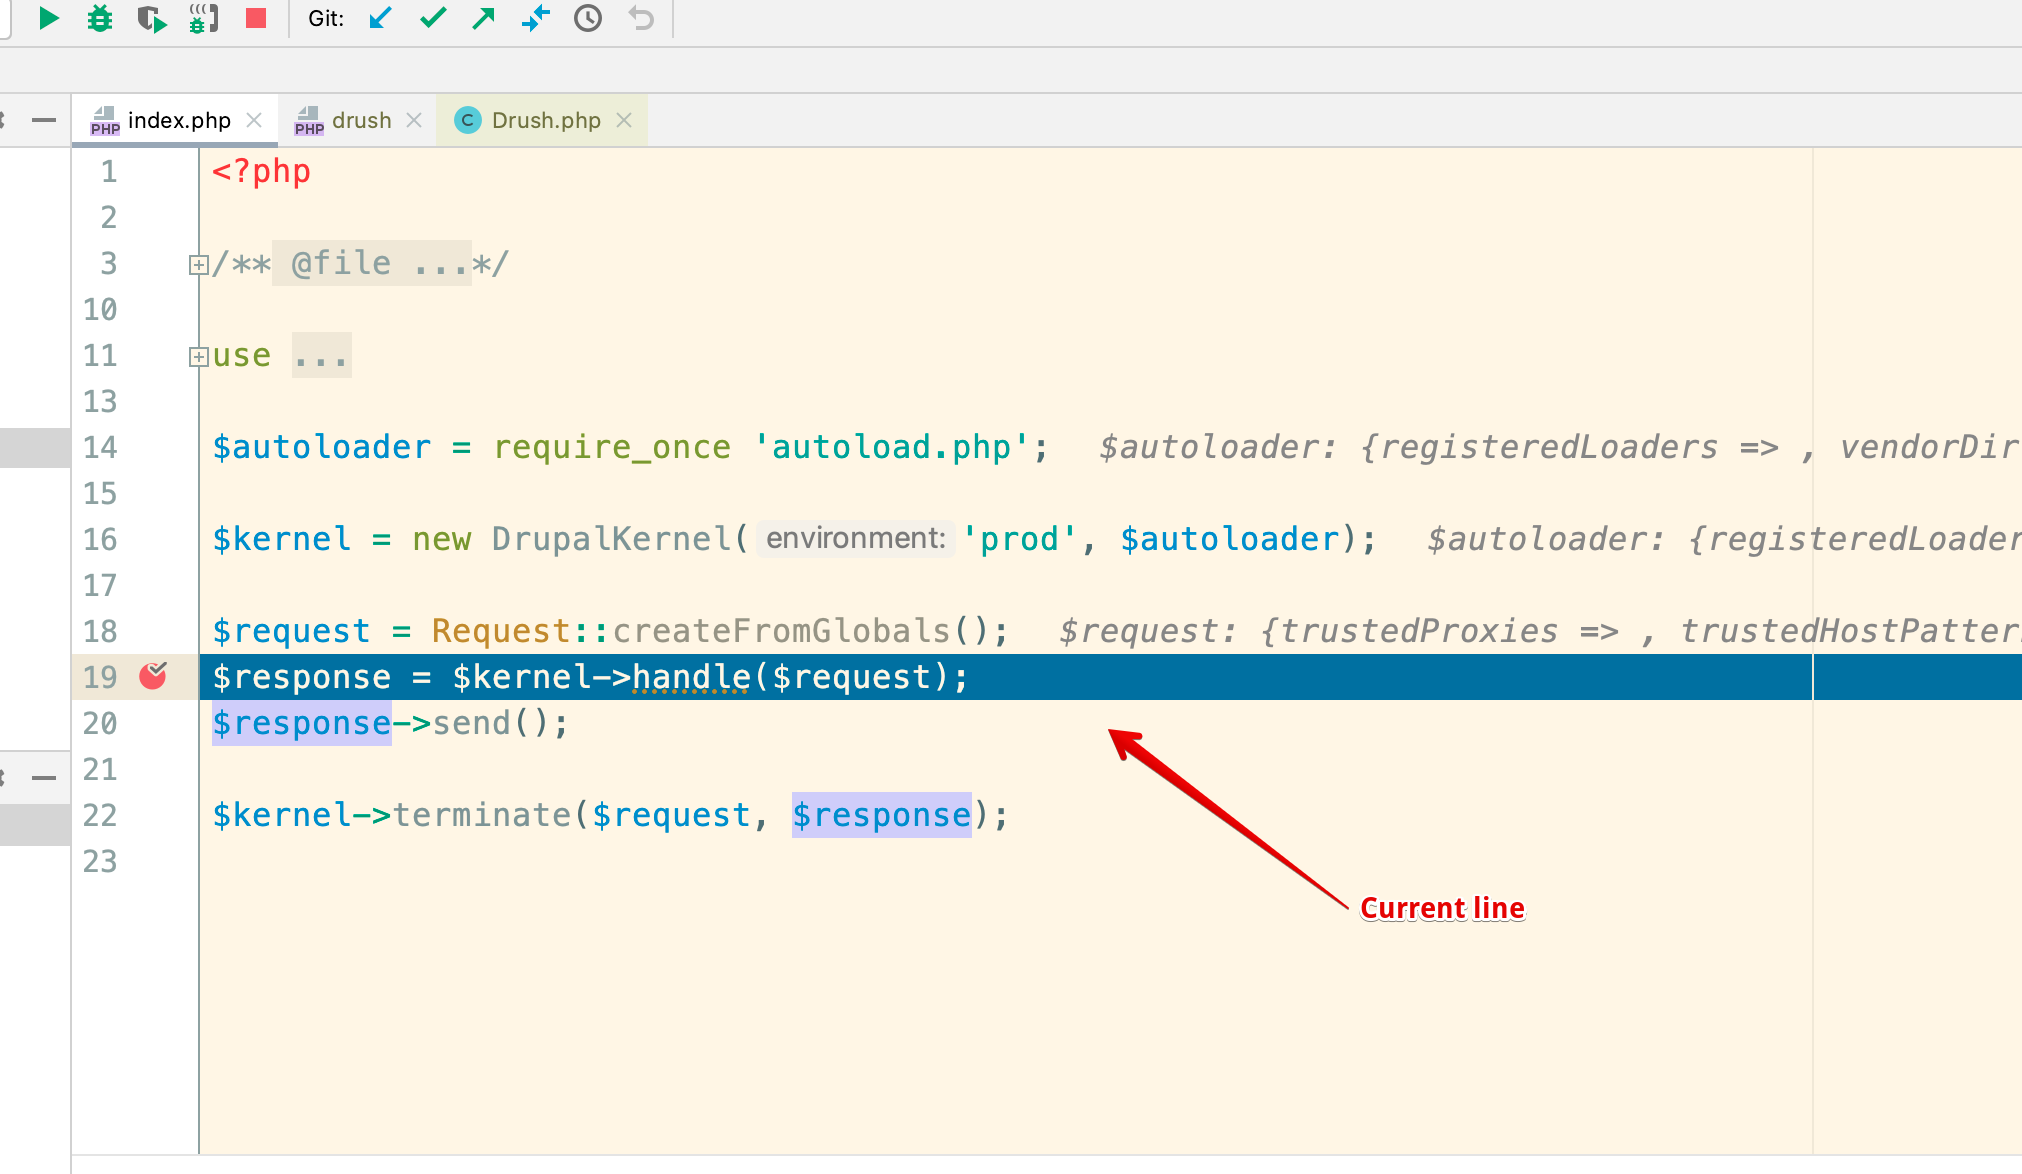
To start debugging, open the index.php file and set a breakpoint by clicking on a line number.
Select a breakpoint:
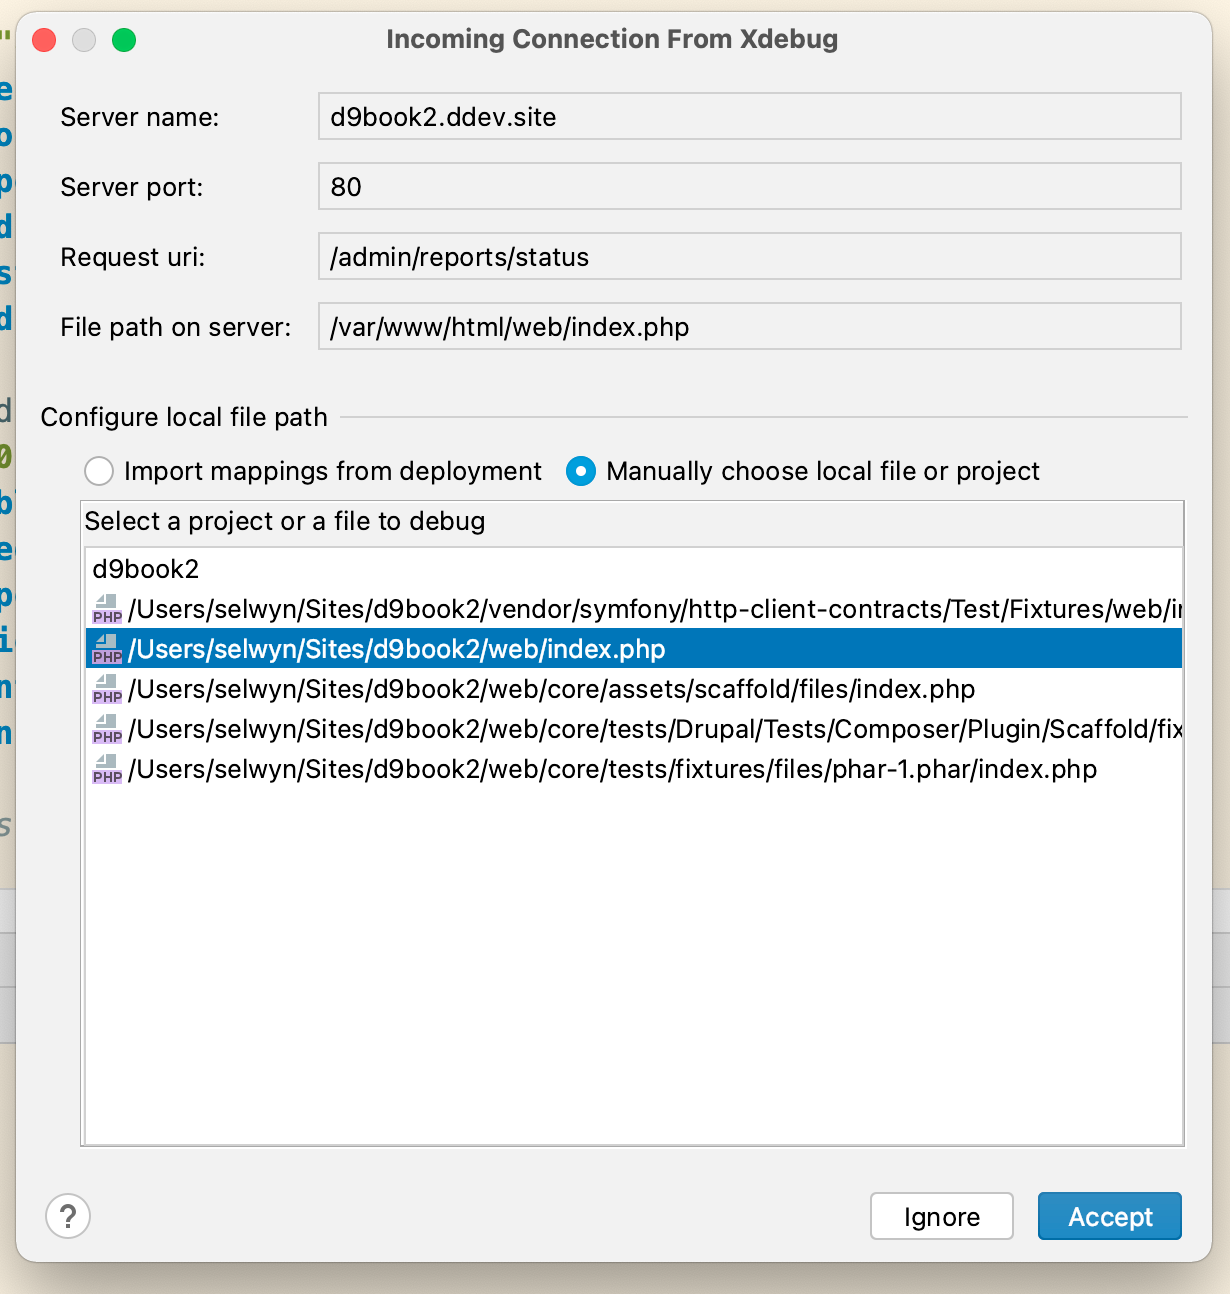
Next refresh the Drupal home page in a browser
You should immediately see a dialog pop up in PhpStorm asking you to to configure your local path. Be sure to click the site/web/index php and click Accept:
Note. If you select one of the other lines you will see a different php file pop up and you won't be debugging Drupal, but probably some Symfony file.
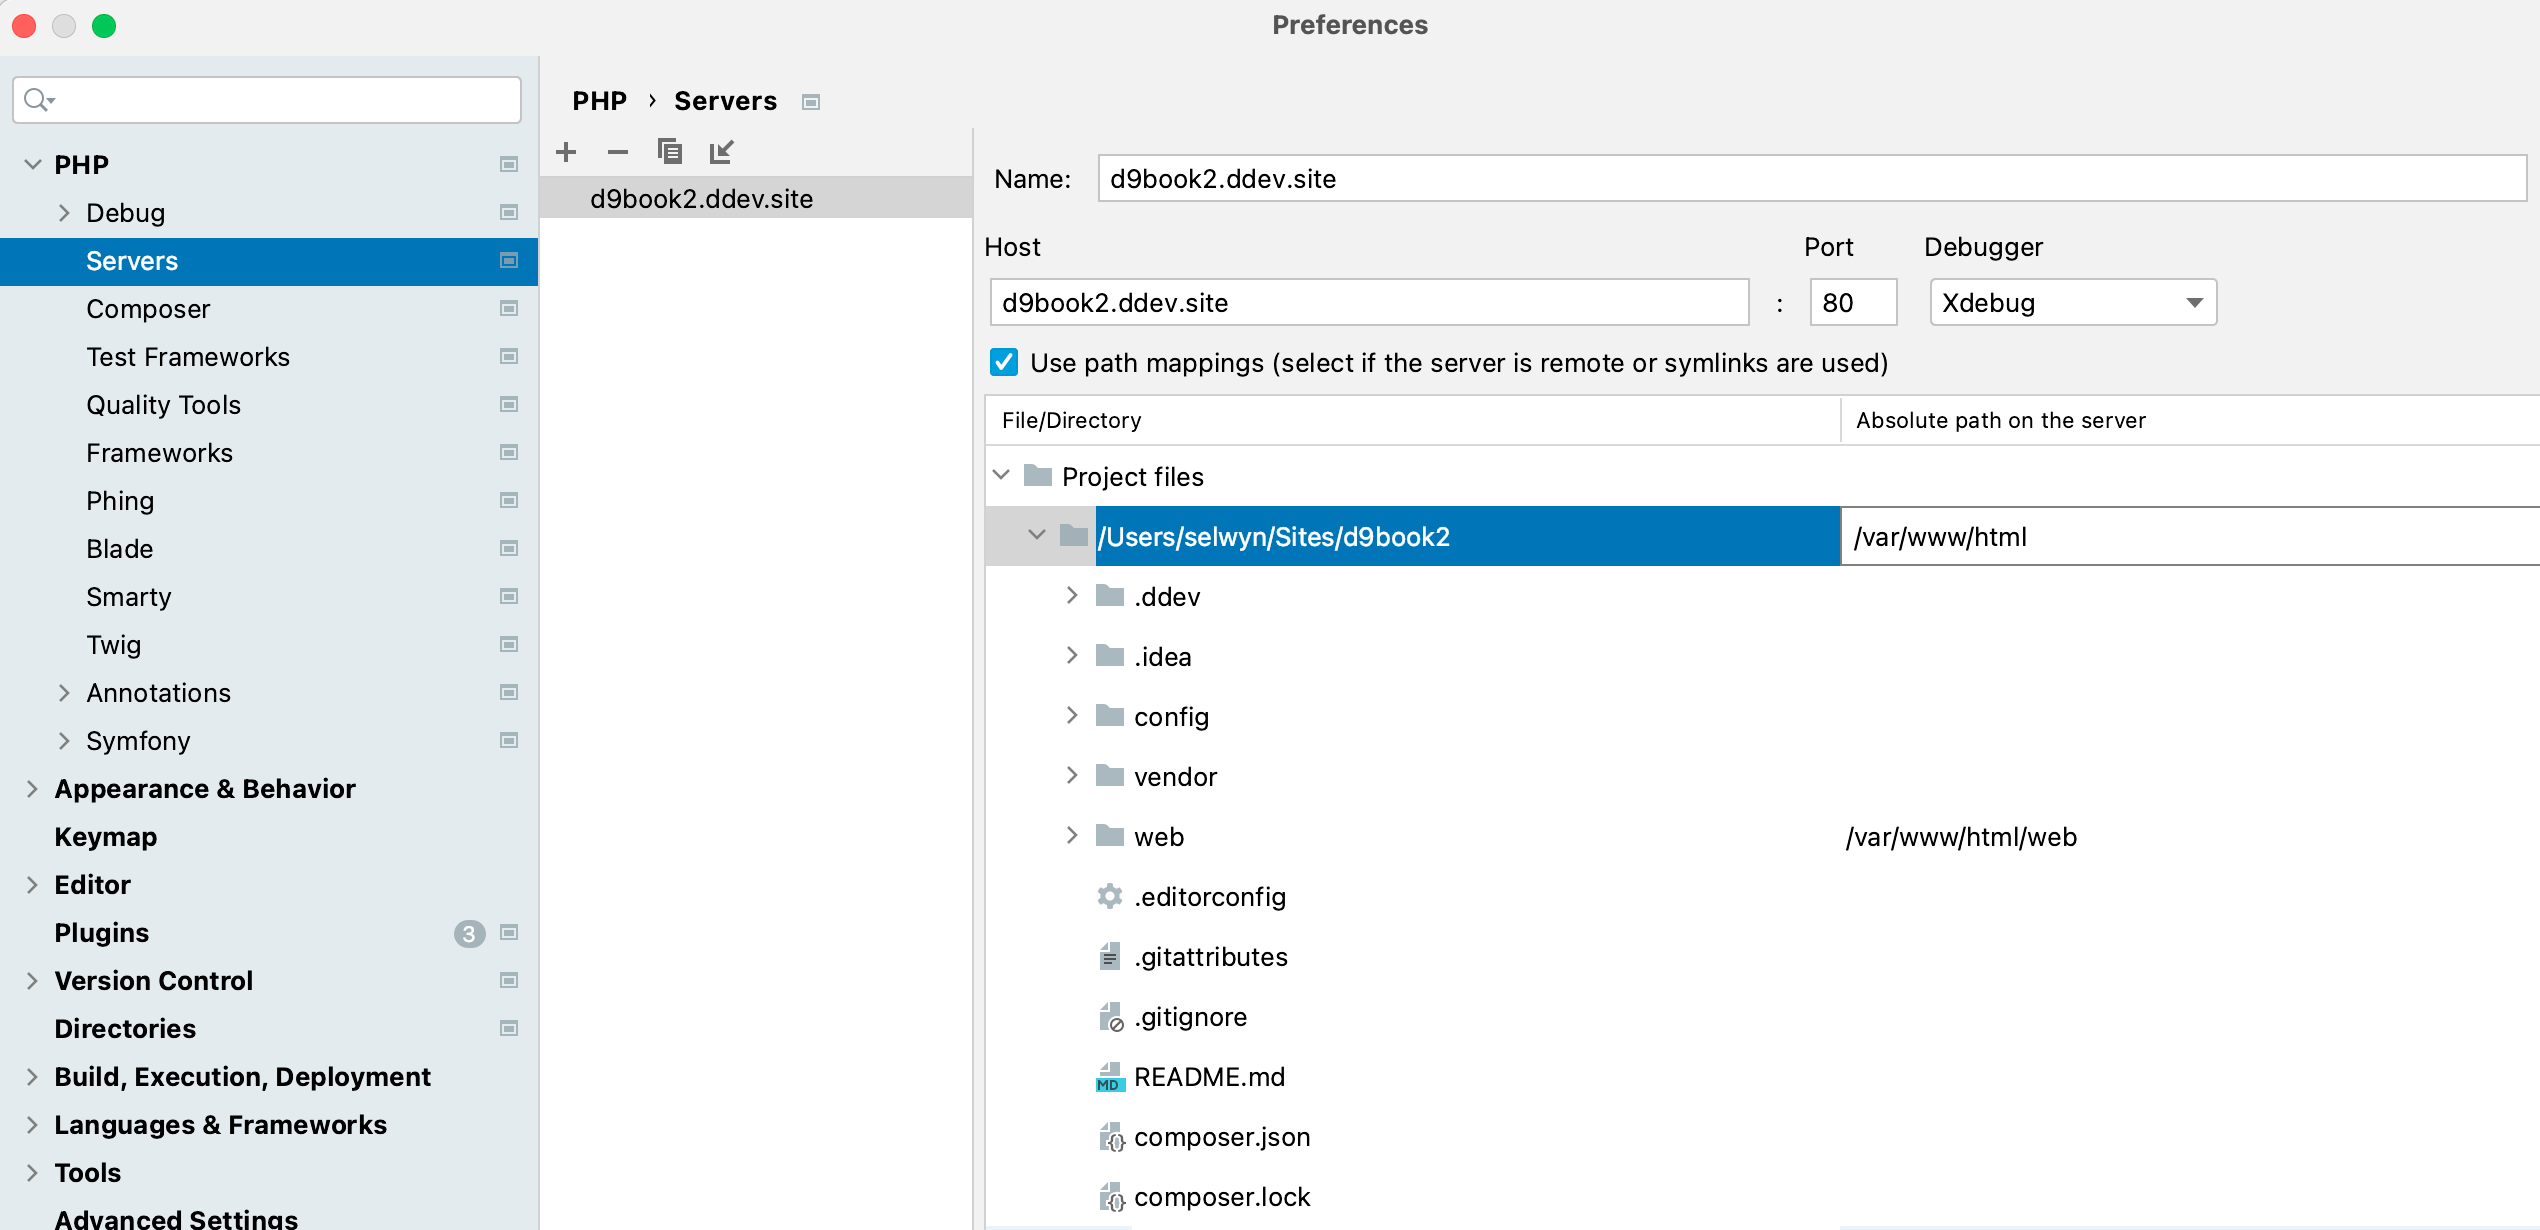
If you accidentally selected the wrong local path, in PhpStorm, go to Settings, PHP, Servers and delete all servers that are displayed. The correct one will be recreated after you retry the operation above.
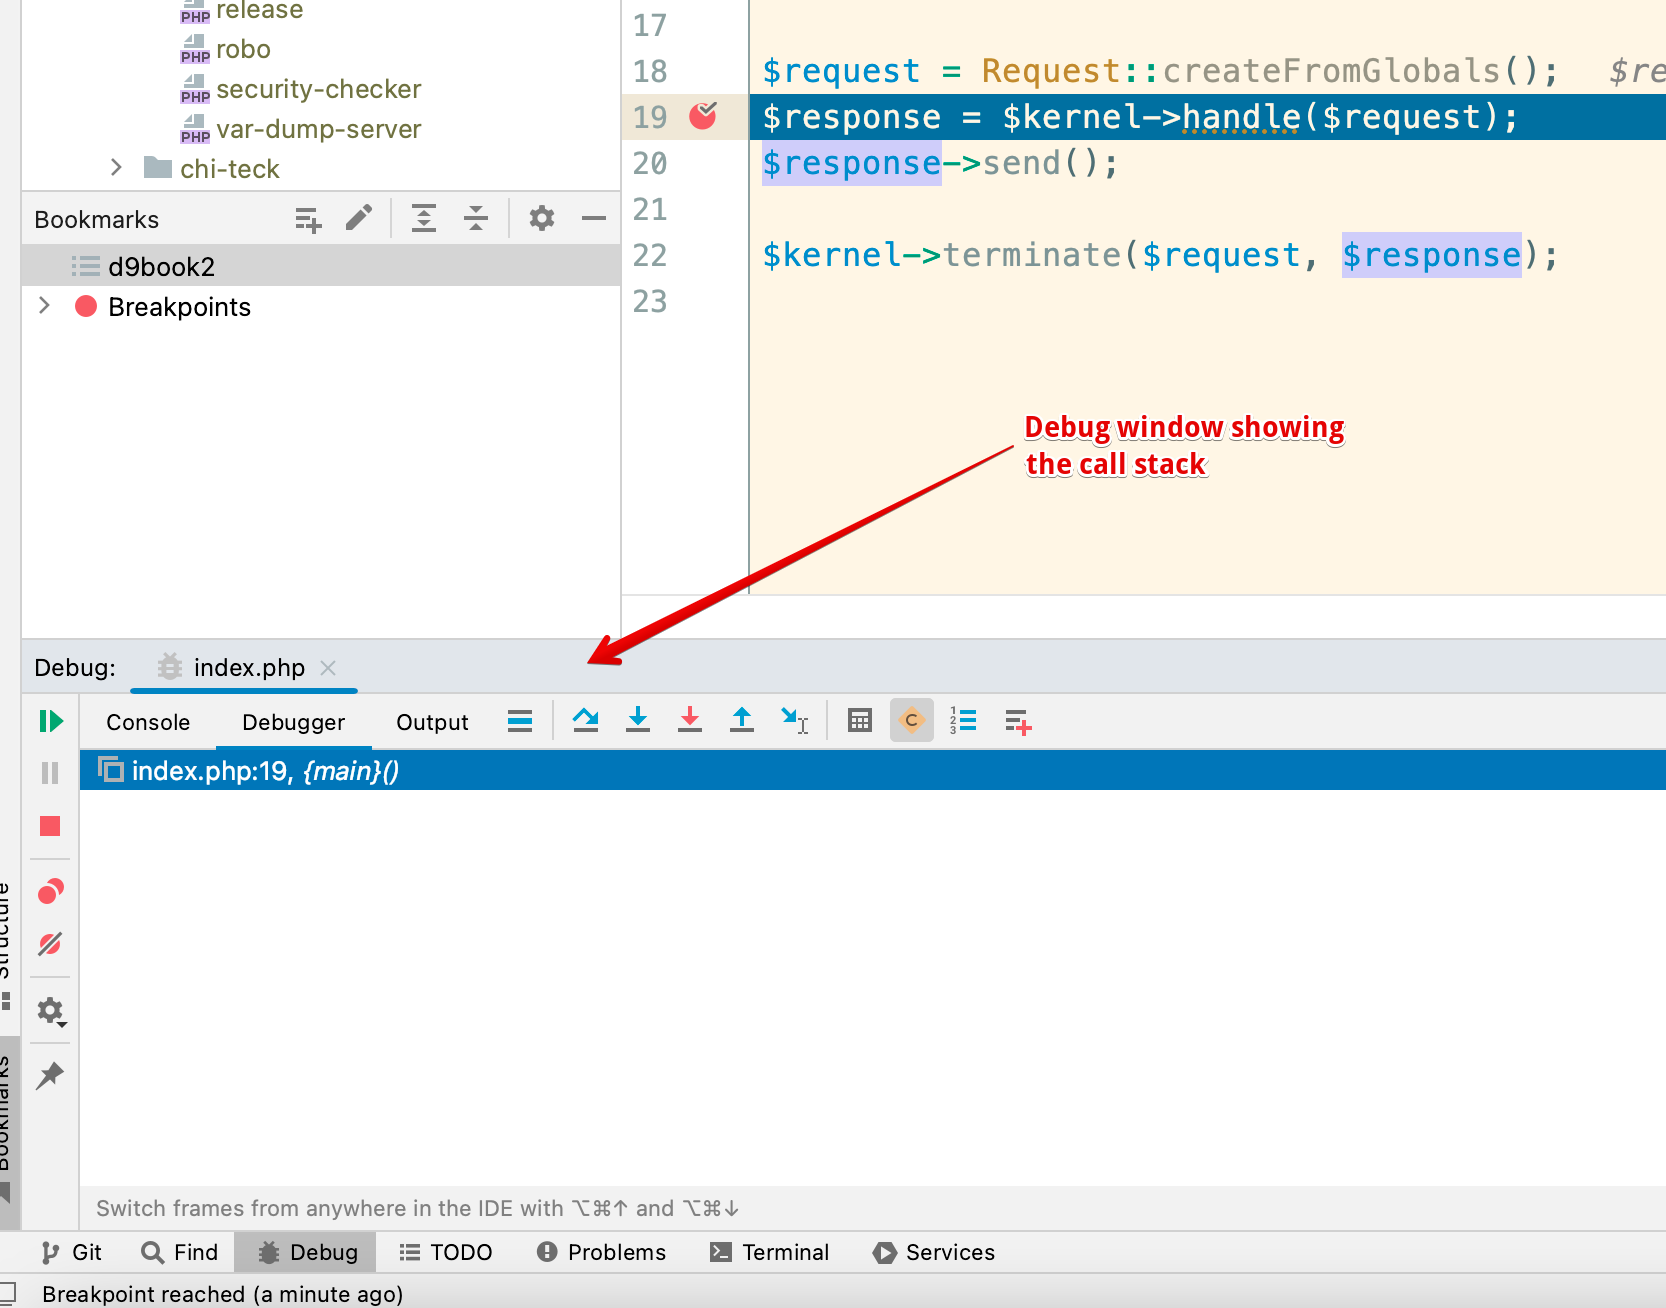
Once you accept the local path, you should see a highlighted line indicating the current line. The debug window will appear below showing the call stack
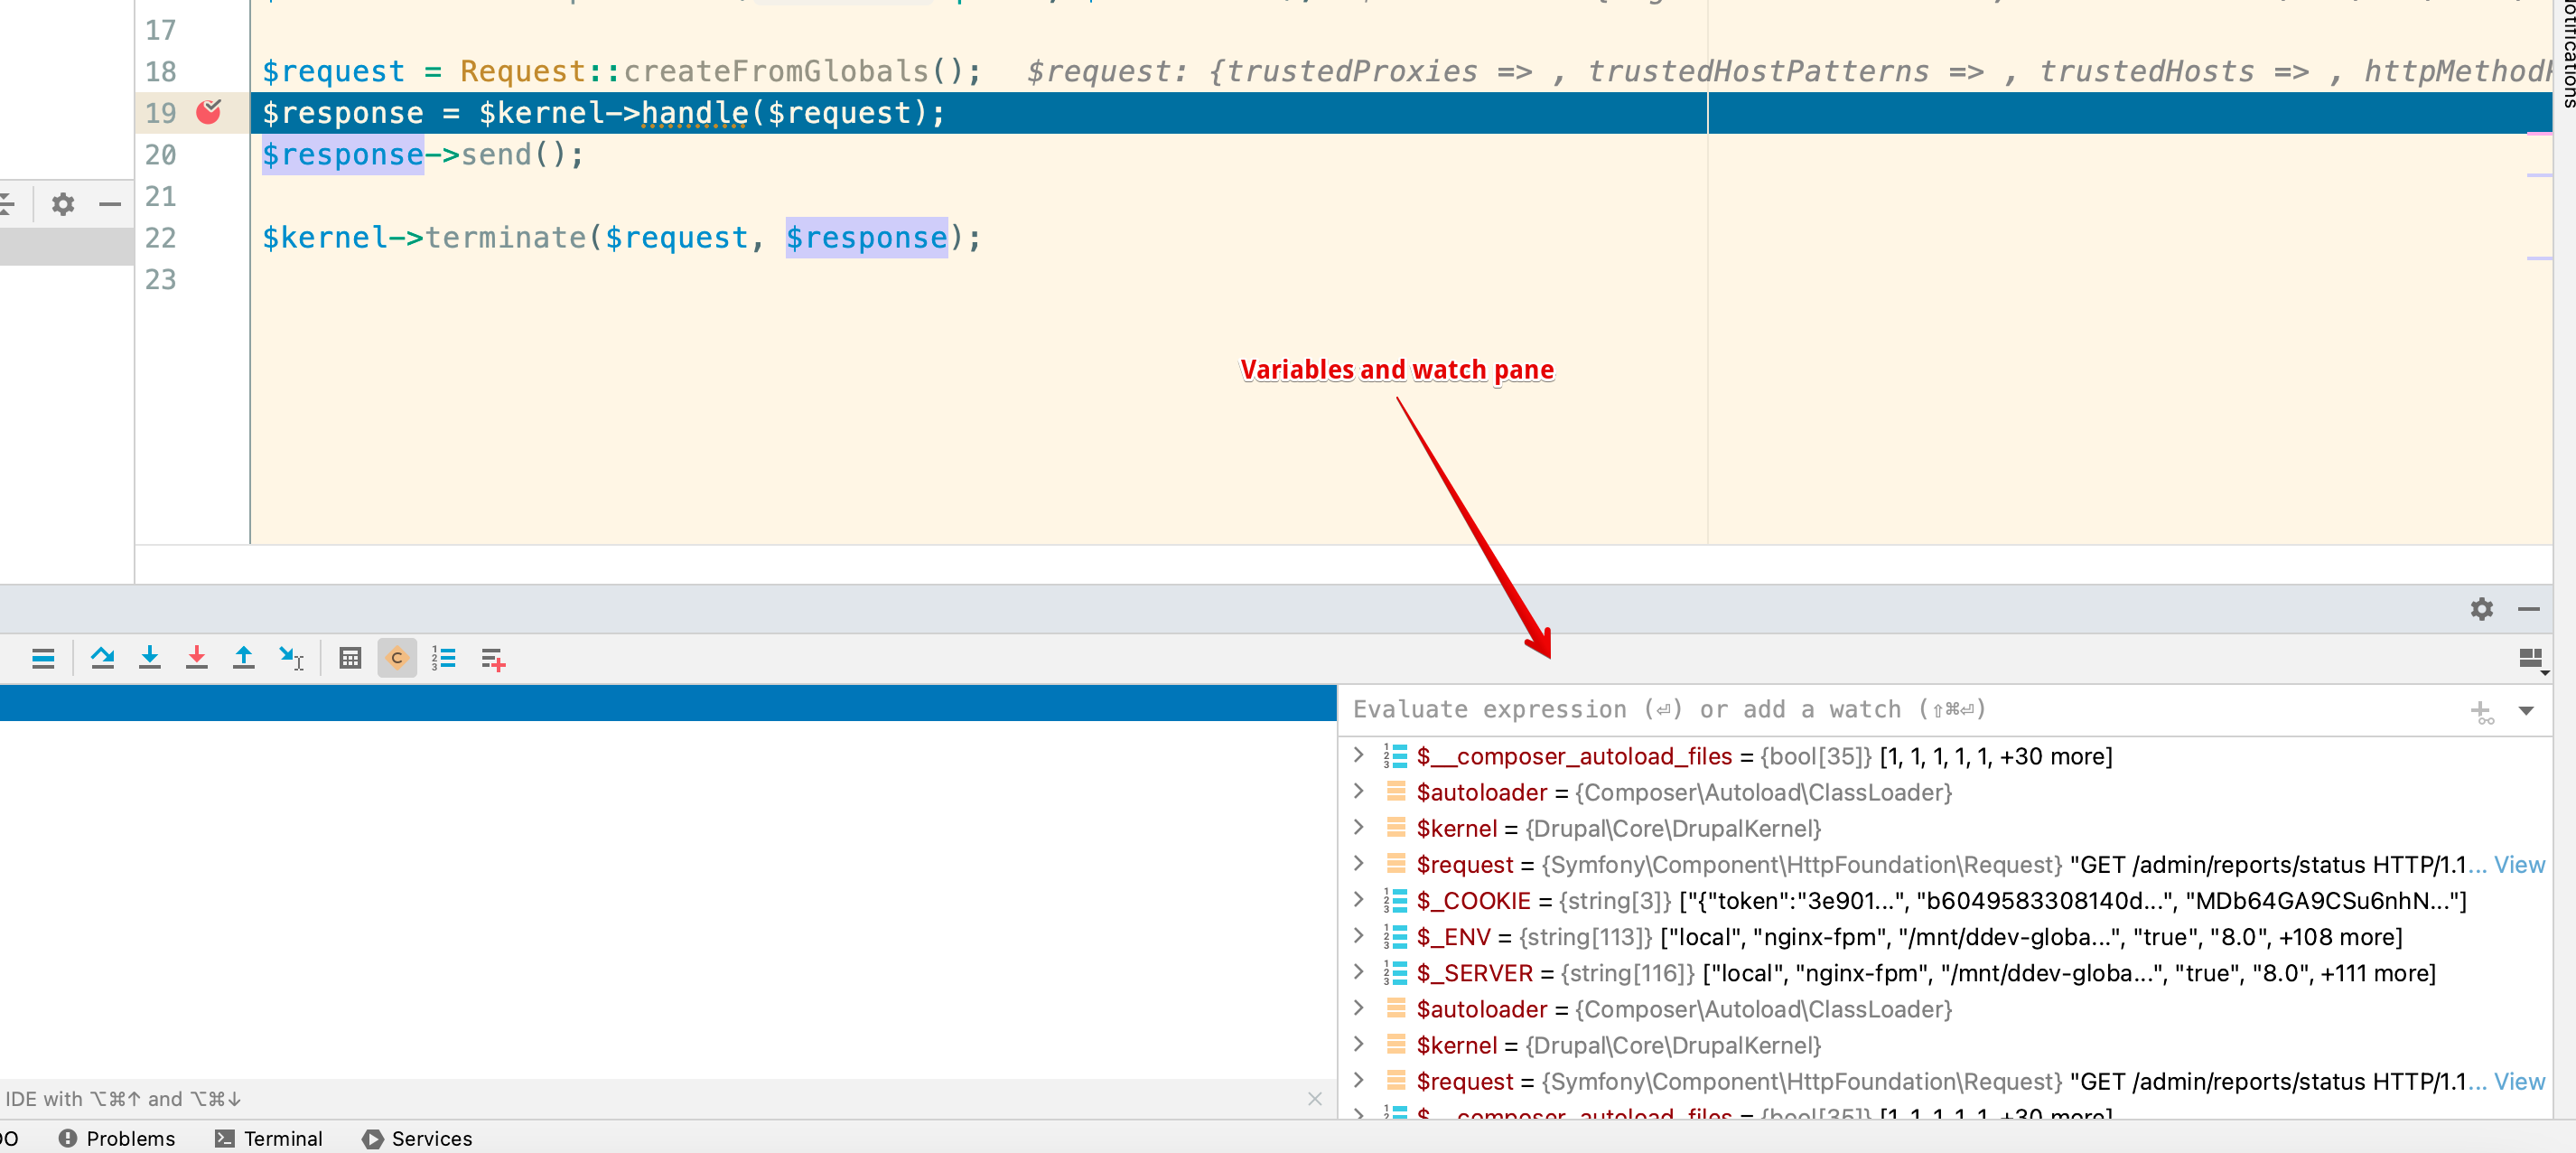
You will also see the variables and watch pane:
Command line or drush debugging
For command line or drush debugging you must run your code from within the DDEV container. This means you must 'ssh' into the DDEV (Docker) container and execute the command you want to debug this way:
$ ddev ssh

$ vendor/bin/drush status
To setup command line debugging, follow the steps above to setup for Drupal Code debugging to confirm that you have debugging working. Then look in PhpStorm's: settings, PHP, Servers, and select the server you set up from the previous steps. Specify the top level path as shown below. Usually it will be /var/www/html
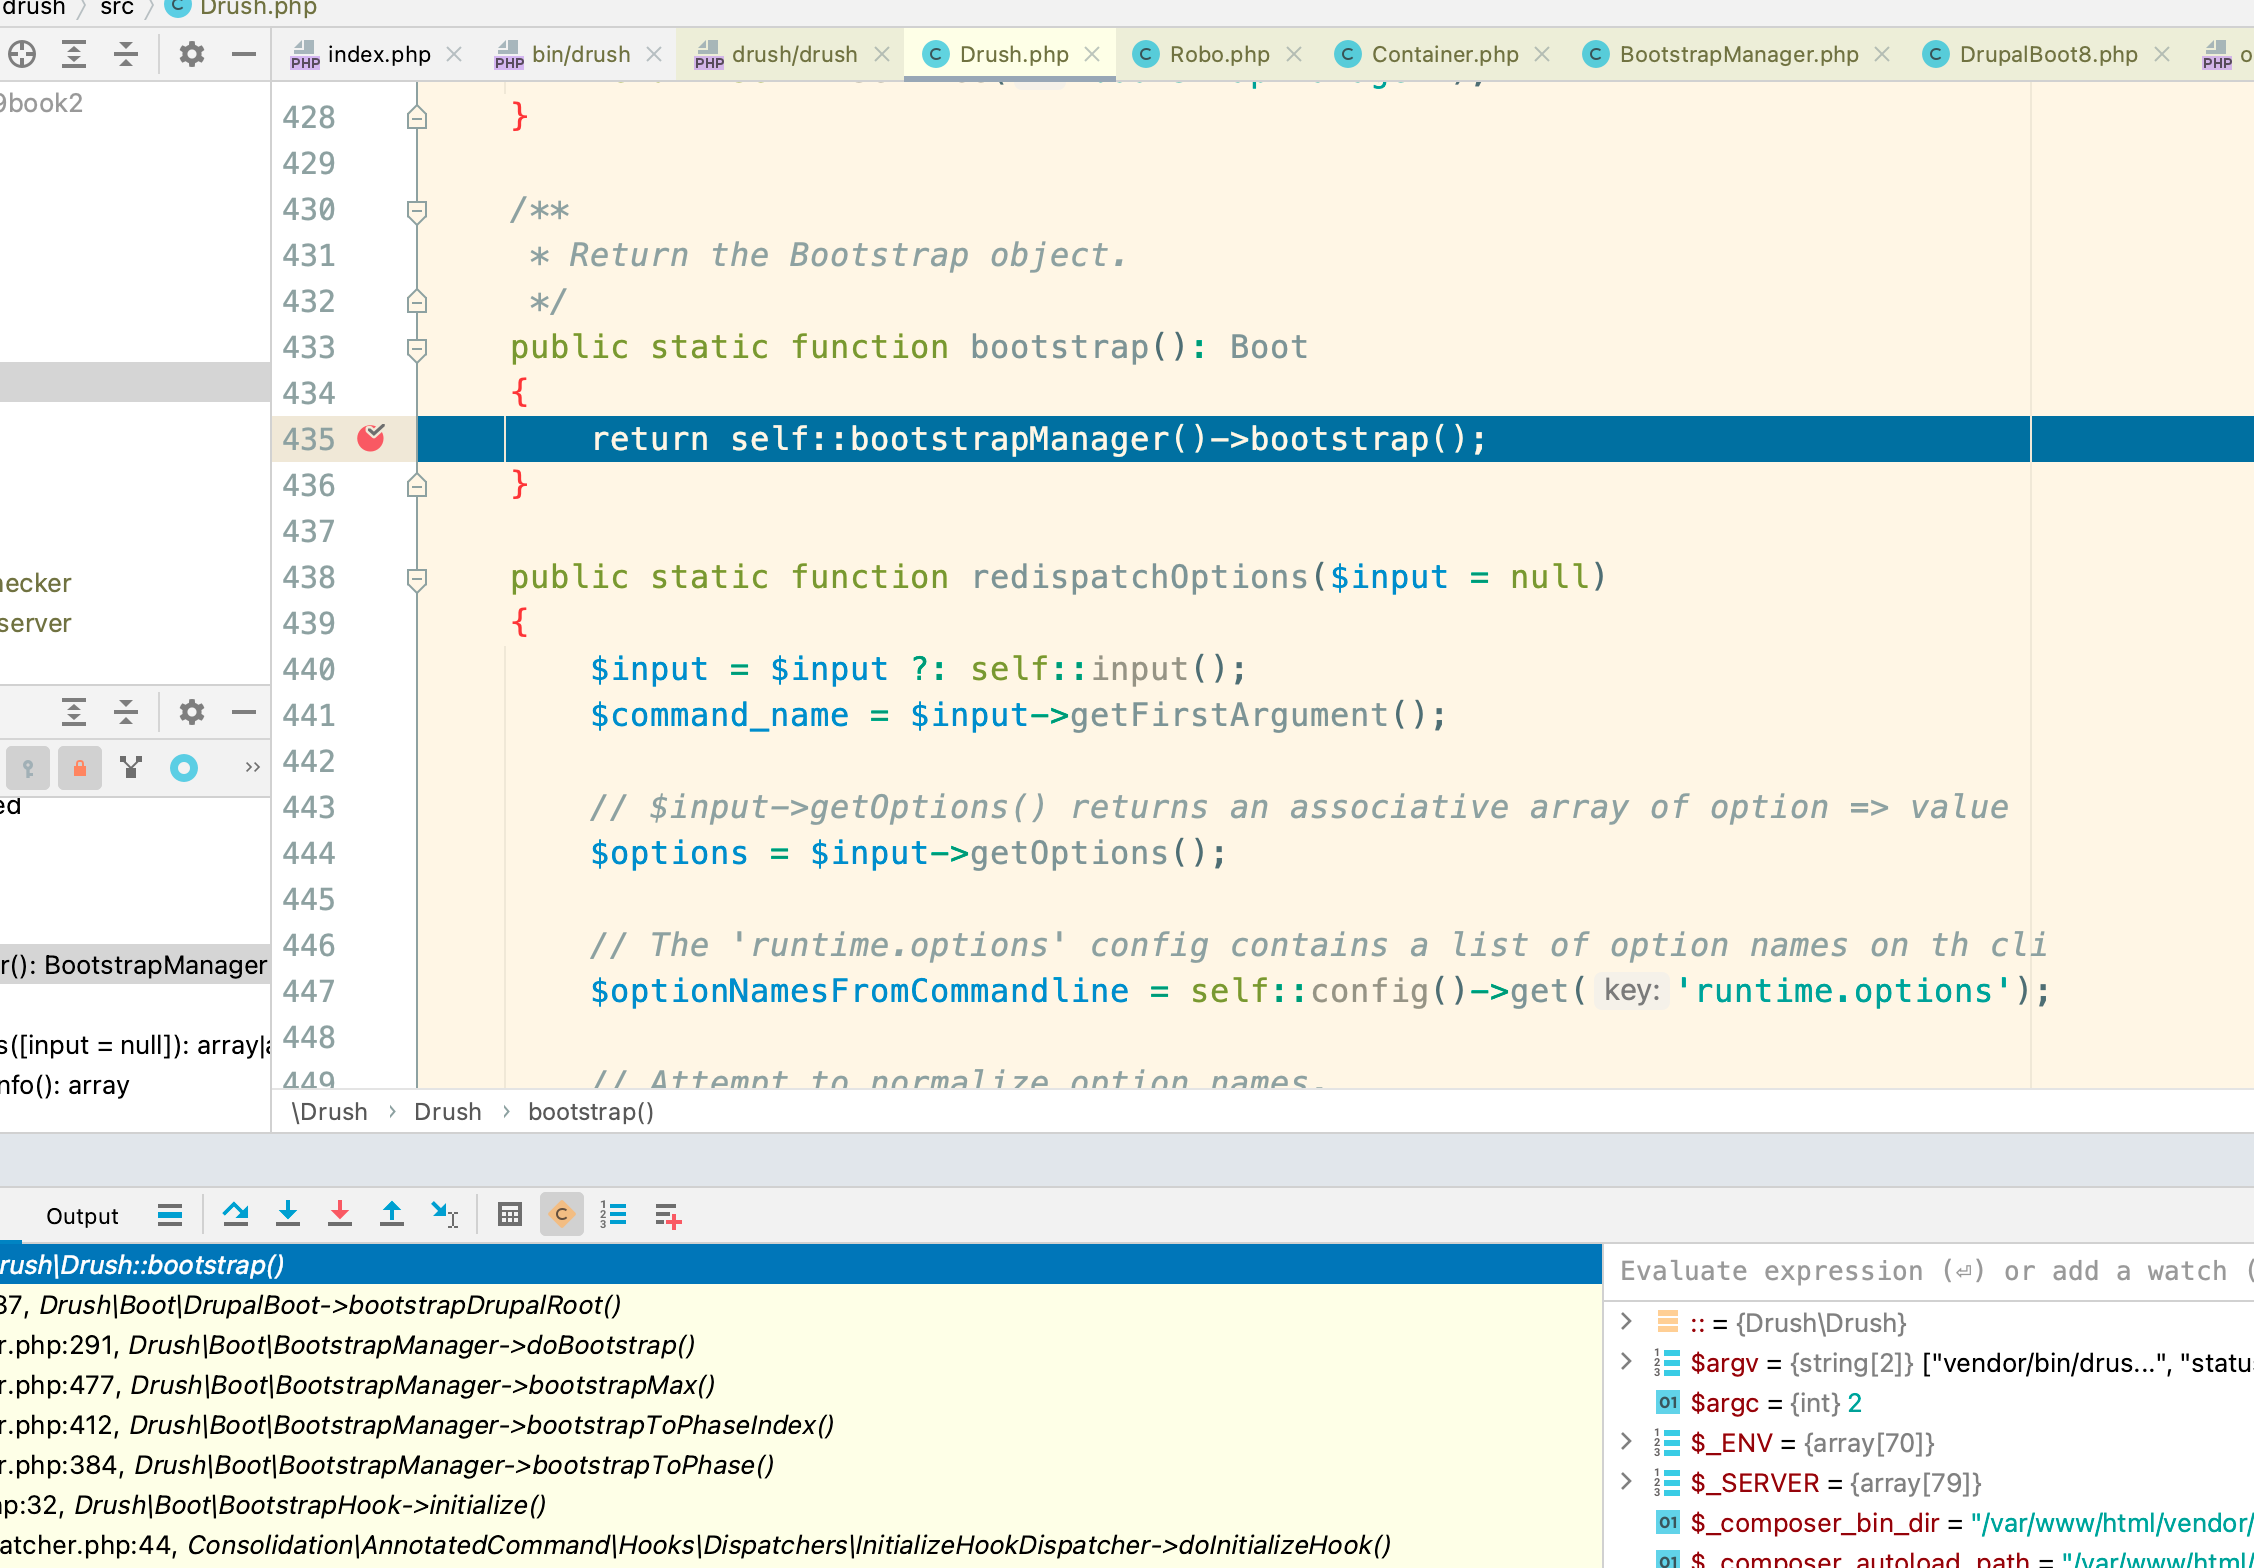
Next open vendor/drush/drush/src/Drush.php and specify a breakpoint like this:
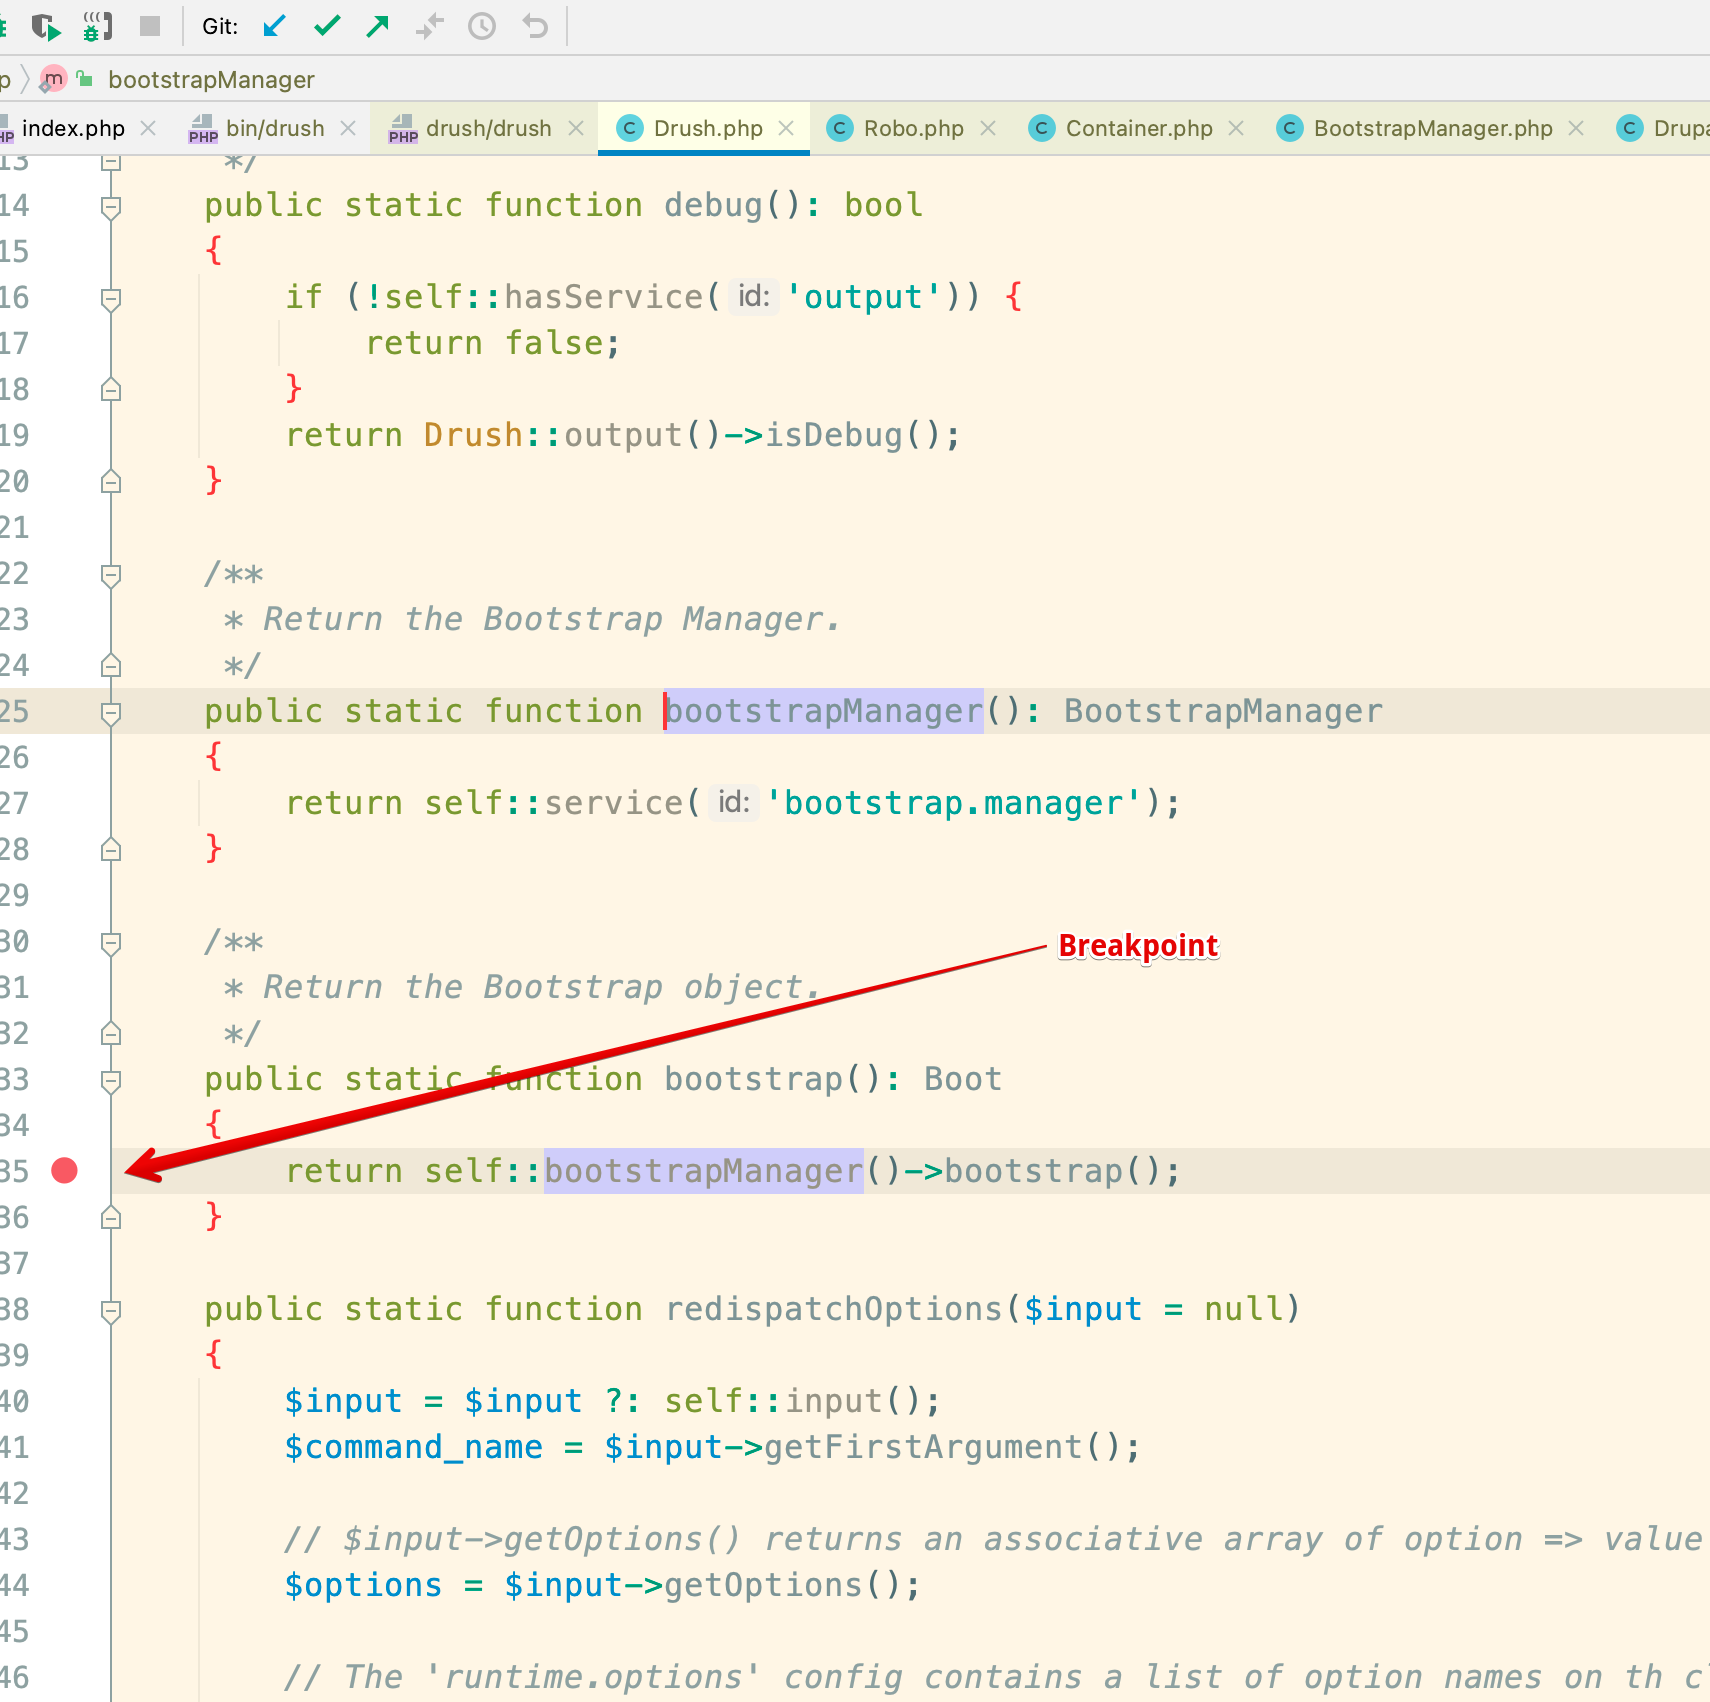
Now in the terminal ssh into the DDEV container and execute drush:
$ ddev ssh

$ vendor/bin/drush status
PhpStorm will pop up and display the current line and you can debug to your heart's content:
More at https://ddev.readthedocs.io/en/stable/users/debugging-profiling/step-debugging/
Add a breakpoint in code
To add a breakpoint in code, you can also use: xdebug_break().
Debugging Cache tags
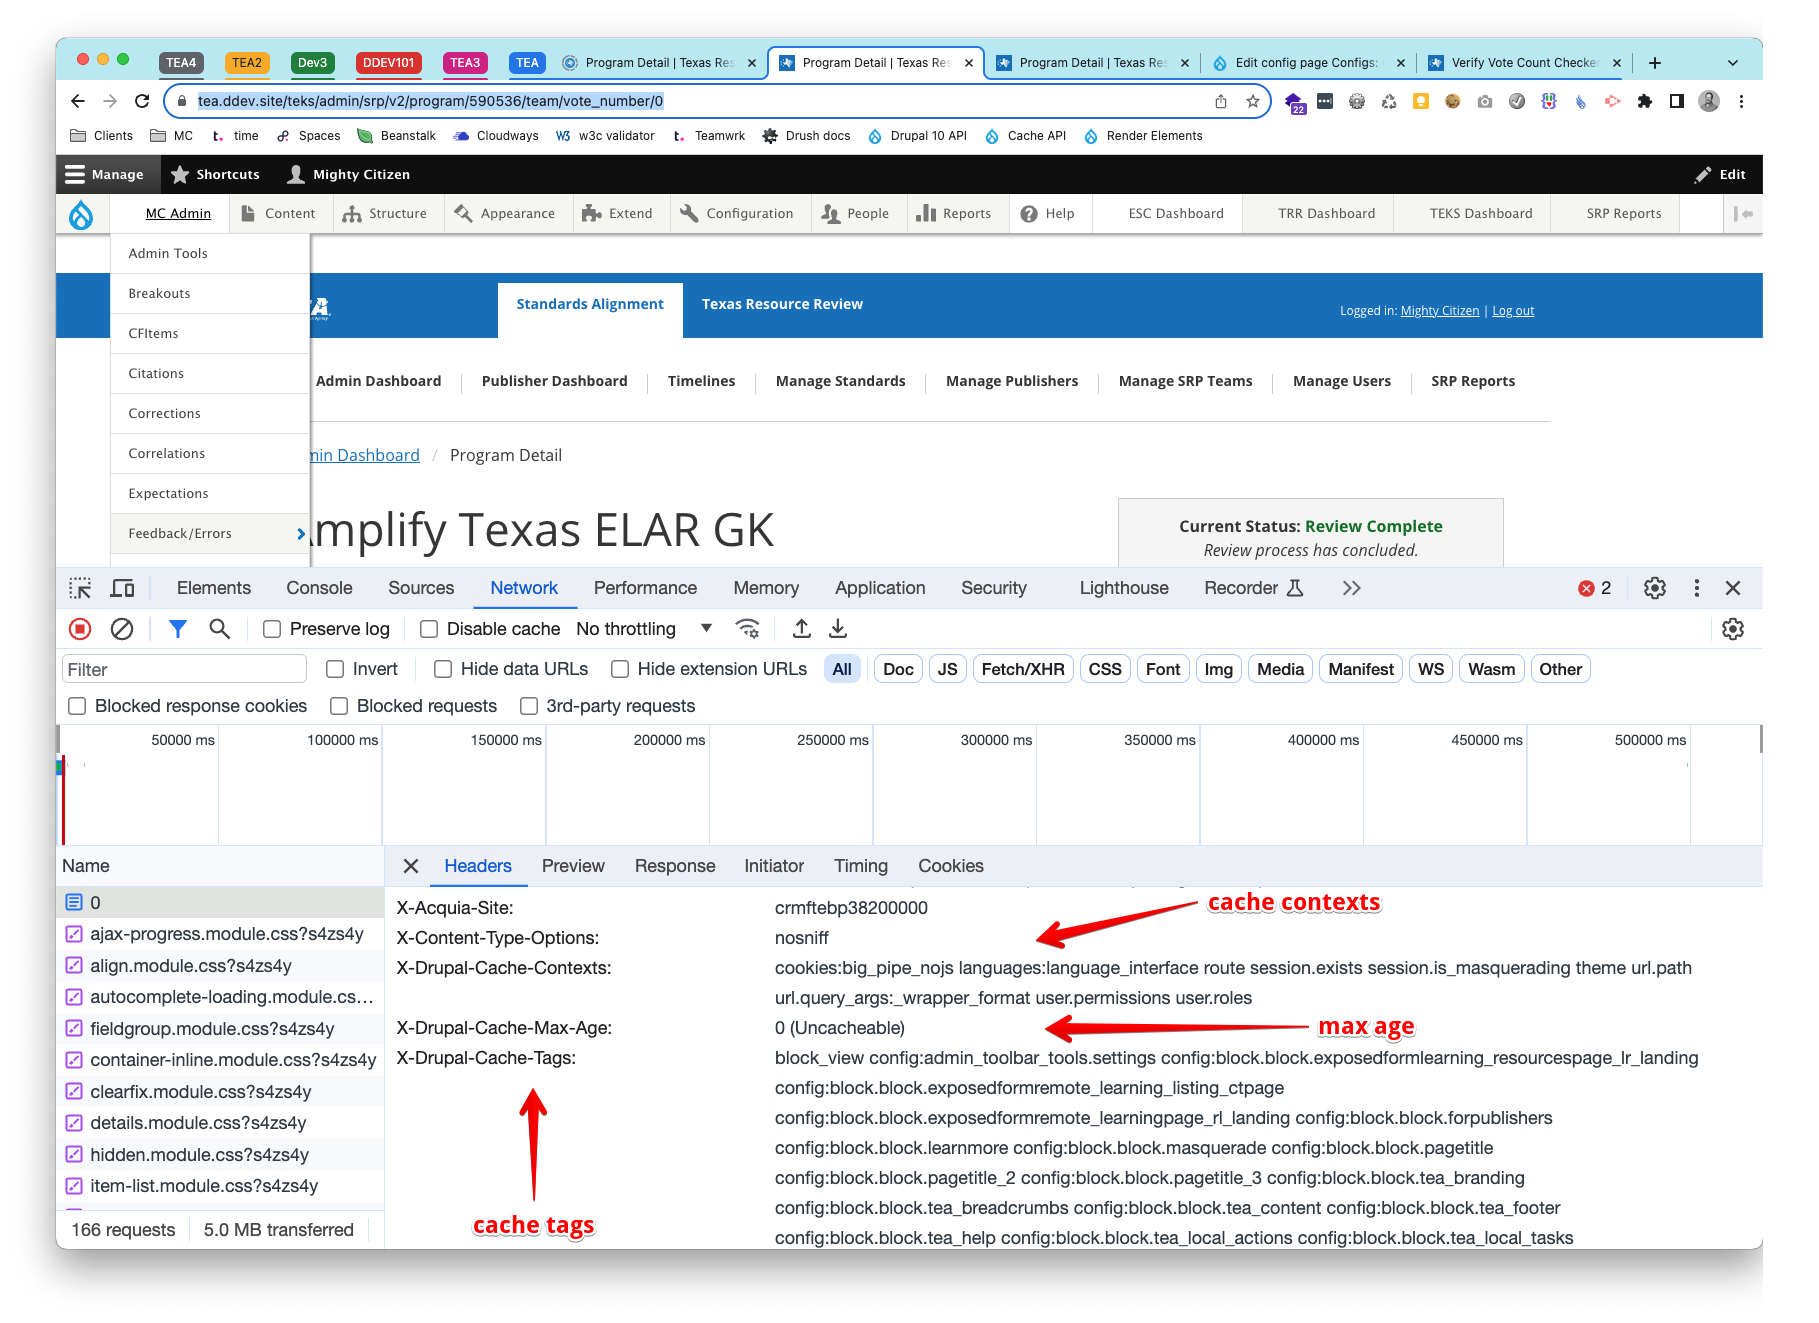
In development.services.yml set the http.response.debug_cacheability_headers parameter:
parameters:
  http.response.debug_cacheability_headers: true
Open the inspect pane in the browser, on the network tab, click on the doc (the first item at the top of the list) and scroll down to the response headers. You will see the following headers: X-Drupal-Cache-Tags, X-Drupal-Cache-Contexts and X-Drupal-Cache-Max-Age which show the cache tags, contexts and max age.
e.g at this URL: https://tea.ddev.site/teks/admin/srp/v2/program/590536/team/vote_number/0
More on debugging cache tags - CacheableResponseInterface and debugging cache tags in the cache API
Install Xdebug Profiling with DDEV
from https://ddev.readthedocs.io/en/stable/users/debugging-profiling/xdebug-profiling/
- Create the directory
.ddev/xdebug, which is where the output files will be dumped. - Switch Xdebug to profiling mode by adding this in
.ddev/php/xdebug.ini:
xdebug.mode=profile
xdebug.start_with_request=yes
xdebug.output_dir=/var/www/html/.ddev/xdebug
xdebug.profiler_output_name=trace.%c%p%r%u.out
Enable Xdebug with
ddev xdebug on.Make an HTTP request to the DDEV project and the profile will be located in
.ddev/xdebugdirectory.Analyze it with any call graph viewer, for example kcachegrind.
When you’re done, execute
ddev xdebug offto avoid generating unneeded profile files.
You can load the files ending in .out in a utility like qcachegrind. This is installed with: brew install qcachegrind
Troubleshooting Xdebug with DDEV
Could not connect to debugging client
When debugging command line e.g. drush commands etc. if you see:
$ vendor/bin/drush status

Xdebug: \[Step Debug\] Could not connect to debugging client. Tried: host.docker.internal:9003 (through xdebug.client_host/xdebug.client_port).
This means you have not clicked the PhpStorm button: "Start listening for PHP Debug Connections". Just click it and try again
PhpStorm refuses to debug
Here are some steps to try:
Curl
Use curl or a browser to create a web request. For example:
$ curl https://d9.ddev.siteReplace d9.ddev.site with the correct URL for your site.
Logs
If the IDE doesn't respond, take a look at ddev logs. Use ddev logs to display current logs for the project's web server. See https://ddev.readthedocs.io/en/stable/users/basics/commands/#logs for more.
If you see a message like
"PHP message: Xdebug: [Step Debug] Could not connect to debugging client. Tried: host.docker.internal:9000 (through xdebug.client_host/xdebug client_port)"then php/xdebug (inside the container) is not able to make a connection to port 9000.
This means you have not clicked the "Start listening for PHP Debug Connections" button in PhpStorm. Just click it and try again.
Note. Port 9003 is more current.
Telnet
With PhpStorm NOT listening for a PHP Debug connection, try to telnet to see what is listening to port 9003 with this:
$ telnet d9book2.ddev.site 9003You should get connection refused. If you get a connection (see below) something is listening on port 9003 and you should either disable it or use a different port. Note. You must set that in both PhpStorm as well as DDEV.
This shows a connection succeeding. You can try it with PhpStorm listening for a debug connection:
$ telnet d9book2.ddev.site 9003

Trying 127.0.0.1\...

Connected to d9book2.ddev.site.

Escape character is \'\^\]\'.
Use Control [] to exit and then type quit to return to exit telnet.
On a mac, use sudo lsof -i :9003 -sTCP:LISTEN to find out what is listening on that port and stop it, or change the xdebug port and configure both DDEV and PhpStorm to use the new one .
More about changing ports at https://ddev.readthedocs.io/en/stable/users/debugging-profiling/step-debugging/#using-xdebug-on-a-port-other-than-the-default-9003
Note. In the past, php-fpm was likely to be one of the apps using port 9000.
Is Xdebug enabled?
• To check to make sure that Xdebug is enabled, you can use php -i | grep xdebug inside the container. You can also use other techniques to view the output of phpinfo(), including Drupal's admin/reports/status/php. Below you can see the expected output when Xdebug is enabled assuming you have Xdebug v3.2.0 or later.
`$ php -i | grep "xdebug.remote_enable"`

xdebug.remote_enable => (setting renamed in Xdebug 3) => (setting renamed in Xdebug 3)
See https://ddev.readthedocs.io/en/stable/users/step-debugging
What is listening on the debug port?
To check if something is listening on port 9003, it's best to use lsof as it will actually list the name of the process listening.
i.e. Here we see phpstorm listening:
lsof -i TCP:9003
COMMAND    PID   USER   FD   TYPE             DEVICE SIZE/OFF NODE NAME
phpstorm 78897 selwyn  209u  IPv4 0x4d118c80f54422d7      0t0  TCP *:9003 (LISTEN)
You can also use nc and netstat but they is not quite as informative:
$ nc -z localhost 9003
Connection to localhost port 9003 [tcp/*] succeeded!
The message Connection to localhost port 9003 [tcp/*] succeeded! means that there is a program listening on port 9003. If you get nothing when you type the command, then nothing is listening.
Here netstat reports that something is listening on port 9003. Again, if you get nothing when you type the command, then nothing is listening.
$ netstat -an | grep 9003
tcp4       0      0  *.9003                 *.*                    LISTEN
Here is an example running lsof and finding php-fpm listening on port 9000
$ lsof -i TCP:9000

COMMAND PID USER FD TYPE DEVICE SIZE/OFF NODE NAME

php-fpm 732 selwyn 7u IPv4 0x4120ed57a07e871f 0t0 TCP
localhost:cslistener (LISTEN)

php-fpm 764 selwyn 8u IPv4 0x4120ed57a07e871f 0t0 TCP
localhost:cslistener (LISTEN)

php-fpm 765 selwyn 8u IPv4 0x4120ed57a07e871f 0t0 TCP
localhost:cslistener (LISTEN)
Enable twig debugging output in source
In sites/default/development.services.yml in the parameters, twig.config, set debug:true. See core.services.yml for lots of other items to change for development.
# Local development services.
#
parameters:
  http.response.debug_cacheability_headers: true
  twig.config:
    debug: true
    auto_reload: true
    cache: false

# To disable caching, you need this and a few other items
services:
  cache.backend.null:
    class: Drupal\Core\Cache\NullBackendFactory
You also need this in settings.local.php:
/**
 * Enable local development services.
 */
$settings['container_yamls'][] = DRUPAL_ROOT . '/sites/development.services.yml';
You also need to disable the render cache in settings.local.php with:
$settings['cache']['bins']['render'] = 'cache.backend.null';Devel and Devel Kint Extras
From https://www.webwash.net/how-to-print-variables-using-devel-and-kint-in-drupal
Setup
We need both the Devel and Devel Kint Extras module. Devel Kint Extras ships with the kint-php library so installing this via Composer will take care of it automatically.
Install using Composer:
composer require drupal/devel drupal/devel_kint_extrasEnable both with the following Drush command:
$ ddev drush en devel_kint_extras -yFinally, enable Kint Extended as the Variables Dumper. To do this go to:
admin/config/development/devel
and select Kint Extender and Save the configuration
Add kint to a custom module
function custom_kint_preprocess_page(&$variables) {
  kint($variables['page']);
 }
Dump variables in a TWIG template
{{ kint(attributes) }}Kint::dump
From Migrate Devel contrib module, in docroot/modules/contrib/migrate_devel/src/EventSubscriber/MigrationEventSubscriber.php
This is used in migrate to dump the source and destination values.
// We use kint directly here since we want to support variable naming.
kint_require();
\Kint::dump($Source, $Destination, $DestinationIDValues);
Set max levels to avoid running out of memory
Kint can run really slowly so you may have to set maxLevels this way:
Add this to settings.local.php
// Change kint maxLevels setting:
include_once(DRUPAL_ROOT . '/modules/contrib/devel/kint/kint/Kint.class.php');
if(class_exists('Kint')){
  // Set the maxlevels to prevent out-of-memory. Currently there doesn't seem to be a cleaner way to set this:
  Kint::$maxLevels = 4;
}
Resources
- DDEV Documentation
- Debugging with Xdebug in DDEV docs
- Debug Drush commands with PhpStorm at
- Configuring PhpStorm Drupal.org docs updated September 2022
- Debugging Drush commands
- DDEV docs on using a different port for debugging
- How to setup Devel and Kint on Drupal 9 by Alex Aug 2021
- Debugging with VScode, DDEV and Lando by Ankitha Shetty September 2023
- Debugging cache tags - CacheableResponseInterface
- Debugging cache tags in the cache API